TL;DR: STR cap rates average 5–8% in 2026, with 6–10% considered good. The metric compares properties on unleveraged yield but hides three critical problems for STR investors: it smooths variable income into a single number, doesn't catch peak-season revenue inflation, and ignores financing costs that determine your actual returns. Use it with cash-on-cash return, DSCR, and 12-month comp data to see the full picture.
Good STR cap rate: 6–10% (national average 5–8%, roughly 6.2% per AirDNA in 2026)
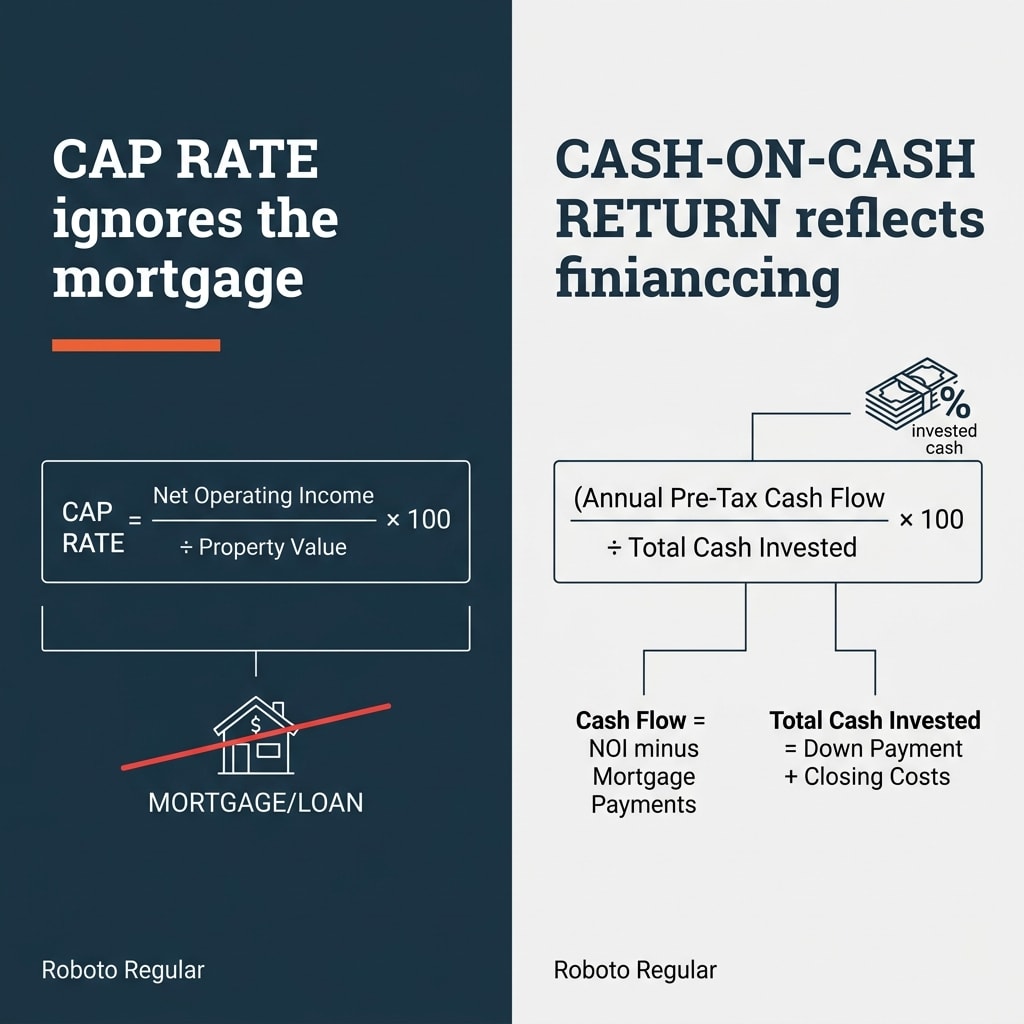
Cap rate formula: (Net Operating Income ÷ Property Value) × 100
STR cap rates should be 2–3 points higher than long-term rentals in the same market to justify the operational complexity
Cap rate ignores financing. Most operators use loans, so cash-on-cash return and DSCR matter more for actual profitability
STR expense ratios run 45–60% of gross revenue, far higher than long-term rentals
I'm looking at a property. The seller calls it a winner. The broker sends a pro forma. Numbers look clean. Cap rate: 8.2%.
I run the math again. Still 8.2%. I compare it to the long-term rental down the street pulling 5%. Looks like a clear win.
Six months later, cash flow doesn't match. November revenue is half of July's. The mortgage stayed the same. The cap rate didn't warn me.
Cap rate is useful for comparing properties on equal footing by stripping out financing. But for short-term rentals, it misleads in three concrete ways: it treats variable income like it's stable, doesn't catch the peak-season-extrapolation trap, and ignores financing that determines whether you make money.
Here's what cap rate is, what it hides, and what to pair it with.
What Is Cap Rate?
Cap rate measures the unleveraged yield of a property. The formula: annual net operating income divided by purchase price or market value, multiplied by 100.
Cap Rate = (Net Operating Income ÷ Property Value) × 100
Example: A property generates $26,000 in annual NOI. You're buying it for $400,000.
$26,000 ÷ $400,000 = 0.065 → 6.5% cap rate.
Cap rate assumes a cash purchase. It strips out the mortgage so you compare properties on operational performance alone. Useful when you're evaluating five properties in different price ranges. Less useful when you're figuring out if the deal works after you introduce a loan.
Key point: Cap rate compares properties cleanly but doesn't tell you if your financed deal will cash flow.
What's a Good STR Cap Rate in 2026?
The national average for short-term rentals sits between 5% and 8% in 2026, per Awning's updated benchmarks. Down from the 7–10% range common in 2020–2021, when property values were lower and competition thinner.
AirDNA pegged the US average at roughly 6.2% in their earlier data. That's an older snapshot, but it tracks with the current range.
For context: traditional commercial real estate cap rates fall between 4% and 10%, depending on asset class and market. US multifamily averaged around 5.7% in 2025, per CBRE's H2 2025 report. Core multifamily going-in cap rates hit 4.75% in Q4 2025.
Here's what most operators miss: STR cap rates should run 2–3 percentage points higher than long-term rental cap rates in the same market.
STRs carry more operational complexity, revenue volatility, and regulatory risk. A 6% STR cap rate in a market where long-term rentals yield 5% isn't a good deal. The extra 1% doesn't compensate for the additional risk and effort.
Cap Rate Interpretation (2026):
Below 5%: Rarely justifies the operational risk
5–7%: Average; solid if the market has appreciation tailwind
7–10%: Strong; verify assumptions carefully
Above 10%: Scrutinize carefully — inflated revenue projections or underlying property issues
All benchmarks reflect 2026 data. Markets vary. This is educational content, not financial advice.
Key point: STR cap rates need a 2–3 point premium over long-term rentals in the same market to justify the operational load.
How to Calculate NOI for an STR
Net operating income is what's left after you subtract operating expenses from gross revenue. The mortgage doesn't touch it. Neither do income taxes or depreciation.
Step 1: Calculate gross annual revenue
Formula: Average daily rate × occupancy rate × 365, plus cleaning fees and other guest-paid fees.
Example: $150/night × 70% occupancy × 365 days = $38,325 gross revenue.
The national average Airbnb occupancy in 2026 sits around 56%, translating to roughly 204 occupied nights per year. If you're projecting 70%, you need comp data backing it up.
Step 2: Subtract operating expenses
Operating expenses for a professionally managed STR typically include:
Management fees (15–25% of revenue)
Cleaning and turnover costs
Platform fees (3–5% of bookings)
Property insurance
Property taxes
Utilities
Maintenance and repairs
Supplies and amenities
Don't include the mortgage payment. Cap rate is a pre-financing metric.
A realistic expense ratio for a professionally managed STR: 45–60% of gross revenue, per industry benchmarks from Awning and Guesty.
Example: $38,325 gross revenue – $12,325 operating expenses (roughly 32%) = $26,000 NOI.
$26,000 ÷ $400,000 purchase price = 6.5% cap rate.
Key point: NOI excludes the mortgage. STR operating expenses run 45–60% of gross revenue, far higher than long-term rentals.
Why Cap Rate Misleads STR Investors
Cap rate works fine for long-term rentals. A tenant signs a 12-month lease at $1,800 per month. You collect $21,600 annually. The revenue is predictable.
Short-term rentals don't work that way.
1. Variable Income Distorts the Picture
STR revenue swings with occupancy, nightly rate, seasonality, local events, and traveler demand. A long-term rental produces $1,800 every month. An STR might produce $6,000 in July and $900 in January.
Cap rate treats that volatility as if it doesn't exist. It smooths the swings into one annual number and hands it to you as a verdict.
A single-year snapshot looks great or terrible depending on when you measured it. If you're calculating cap rate using 12 months that included two major local events and a viral TikTok post about your market, that number won't repeat next year.
2. The Peak-Season-Extrapolation Trap
This is the one burning operators.
A seller pulls August's nightly rate and occupancy, applies it to all 12 months. The math looks great. The cap rate looks great. The purchase happens.
Then November arrives.
The cap rate looked great because the seller used July's nightly rate for all twelve months. Not a hypothetical. It's a pattern we see in consulting calls every month.
Hostaway flags this directly: Airbnb cap rates fluctuate significantly with seasonality. A monthly figure differs greatly from the annual cap rate, leading to a substantially higher cap rate during peak periods compared to the rest of the year.
Use at least 12 months of annualized comp data from comparable active listings. Not the seller's projections. Not peak-week numbers. Actual annualized performance of properties that look like yours.
3. Cap Rate Ignores Financing (Financing Is the Deal)
Cap rate assumes you paid cash. Most operators don't.
The moment you introduce a mortgage, the number that matters to your bank account changes. Cap rate doesn't move with it.
A property with a 7% cap rate and a 7.5% mortgage rate is cash-flow negative from day one. Cap rate won't tell you that.
Per the Corporate Finance Institute and JPMorgan's definitions, cap rate calculations focus only on operational performance. They don't include mortgage payments, loan payments, or financing costs. The assumption is the property is purchased with cash.
That assumption breaks the moment you apply for a loan.
Key point: Cap rate hides revenue volatility, peak-season inflation, and the financing that determines your real outcome.
What to Pair With Cap Rate
Cap rate is useful for comparing properties. Not useful for underwriting a financed purchase. Here's what to run alongside it:
Cash-on-Cash Return
This is the financed version of the question.
Formula: (Annual Pre-Tax Cash Flow ÷ Total Cash Invested) × 100
Cash flow = NOI minus mortgage payments. Total cash invested = down payment plus closing costs.
Example: $400,000 property, 25% down ($100,000), 7% interest rate, 30-year mortgage. Annual mortgage payment: $16,800. NOI: $26,000.
Cash flow = $26,000 – $16,800 = $9,200.
Cash-on-cash return = $9,200 ÷ $100,000 = 9.2%.
Cap rate said 6.5%. Cash-on-cash says 9.2%. They're measuring different things. Cap rate measures the property's operational yield. Cash-on-cash measures your return on the cash you put in.
Use both.
DSCR (Debt Service Coverage Ratio)
DSCR tells you whether the property's income covers its own mortgage.
Formula: NOI ÷ Annual Debt Service
Example: $26,000 NOI ÷ $16,800 annual mortgage payment = 1.55 DSCR.
A DSCR below 1.0 means the property doesn't cover its own mortgage. That's a problem before you factor in your time. Most STR lenders want 1.2 or higher.
Annualized Comps
Pull 12 months of revenue data from comparable active listings in the same market. Not projections. Not peak weeks. Actual annualized performance of properties that look like yours.
Tools like AirDNA and Rabbu pull this data. You're looking for average daily rate, occupancy rate, and gross revenue across all 12 months.
If the comps show 55% occupancy and the seller's pro forma assumes 75%, you have a problem. If comps show $120 per night average and the seller used $180, the cap rate is inflated.
Key point: Cash-on-cash return reflects financing. DSCR shows whether the property covers its mortgage. Annualized comps catch inflated projections.
Run the better numbers free with our STR Investment Calculator and Airbnb Income Calculator. Both tools account for financing, seasonality, and expense ratios so you see the real picture before you sign.
If the cap rate is weak on a purchase, check whether rental arbitrage makes more sense first. Arbitrage lets you test operational fluency before balance sheet exposure.
Frequently Asked Questions
What is a good cap rate for an Airbnb?
A good STR cap rate is 6–10%, with national averages around 5–8% (roughly 6.2% per AirDNA). Below 5% rarely justifies the operational risk. Above 10% warrants scrutiny for inflated revenue assumptions or property problems.
How do you calculate cap rate for a short-term rental?
Divide annual net operating income by the purchase price or market value, then multiply by 100. NOI equals gross annual revenue minus operating expenses, excluding the mortgage. Example: $26,000 NOI ÷ $400,000 = 6.5%.
What's the difference between cap rate and cash-on-cash return?
Cap rate measures unleveraged yield (NOI ÷ value, ignoring financing). Cash-on-cash measures return on the cash you invested after the mortgage. Cap rate compares properties. Cash-on-cash reflects your real, financed outcome.
Does cap rate include the mortgage?
No. Cap rate is a pre-financing metric. NOI excludes mortgage payments, down payment, loan interest, depreciation, and income taxes. It assumes an all-cash purchase so two properties are compared on equal footing.
Why is cap rate higher for short-term rentals than long-term rentals?
STRs carry more operational complexity, revenue volatility, and regulatory risk, so investors expect 2–3 percentage points more yield. Higher gross revenue lifts the rate, but higher operating costs (often 45–60% of revenue) partly offset it.
What is NOI for an Airbnb?
Net operating income is gross annual revenue (nightly rate × occupied nights, plus cleaning and other fees) minus recurring operating expenses: management, cleaning, utilities, insurance, taxes, maintenance. Not mortgage payments or income taxes.
Key Takeaways
Cap rate is a comparison tool, not the full picture. It strips out financing so you compare properties on operational performance alone.
Good STR cap rates run 6–10% (national average 5–8%, roughly 6.2% per AirDNA in 2026). Below 5% rarely justifies the operational risk. Above 10% warrants scrutiny.
STR cap rates should be 2–3 points higher than long-term rentals in the same market to compensate for operational complexity, revenue volatility, and regulatory risk.
Cap rate hides three critical problems for STRs: it smooths variable income into a single number, doesn't catch peak-season revenue inflation, and ignores financing costs that determine your actual returns.
Pair cap rate with cash-on-cash return, DSCR, and 12-month comp data. Cash-on-cash reflects financing. DSCR shows whether the property covers its mortgage. Comps catch inflated projections.
STR operating expenses run 45–60% of gross revenue, far higher than long-term rentals. Most operators underestimate this.
Use annualized comp data from comparable active listings, not seller projections or peak-week numbers. Peak-season extrapolation is the most common cap rate trap.
For short-term rentals, it hides three things: revenue volatility, peak-season traps, and the financing that determines whether you make money.
Run cap rate. Then run cash-on-cash return, DSCR, and annualized comps. The deal that looks strong on cap rate alone might fall apart when you introduce the mortgage. The deal that looks weak on cap rate might work when you account for appreciation and tax benefits.
The math tells you what's real. The cap rate tells you what's comparable.
Weighing a real purchase? Book a free diagnostic call and we'll pressure-test the deal past the cap rate.
Want more STR systems and frameworks? Join 19,000+ operators getting the playbook: CashFlowDiary Newsletter.
Explore more tools and resources: CashFlowDiary Tools | STR Investing Hub
This article is educational content only. Not financial, tax, or investment advice. Benchmarks vary by market and time. Consult a qualified advisor before making purchase decisions.
Learn STR Operations the Right Way
Every operator I work with goes through this audit before we build the second channel, the second guest type, the second pricing model. If you want the full framework — the platforms, the compliance sequence, the pricing model that protects margins through regulatory shifts — that's what we map in the STR diagnostic.
Start your diagnostic →